Java Visualizer: See Your Code Execute Step-by-Step (Free Tools Inside)
backend
17 min read
Java Visualizer: See Your Code Execute Step-by-Step (Free Tools Inside)
Stop guessing why your Java code breaks. These free visualizer tools show you exactly how objects, loops, and recursion work in memory - perfect for debugging and learning.
Published By: Nelson Djalo | Date: June 18, 2025 | Updated: April 5, 2026
Introduction
Ever wished you could peek inside your Java code as it runs? That's exactly what a Java visualizer lets you do. Whether you're debugging tricky logic or trying to understand how objects interact in memory, visualization tools turn abstract concepts into something you can literally see. I remember staring at my first NullPointerException, completely lost - until I discovered visualization tools that showed me exactly where things went wrong.
This post covers the best free visualizer tools, how to use IntelliJ's built-in debugger, and practical tips for getting the most out of visual debugging.
Table of Contents
- What Is a Java Visualizer?
- Why Use Visualization for Debugging?
- Hands-On: Debugging with IntelliJ's Visualizer
- Best Practices for Effective Visualization
- Common Visualization Pitfalls and How to Avoid Them
- Advanced Visualization Techniques
- Troubleshooting Common Visualization Issues
- Alternatives When Visualizers Aren't Enough
- Integration with Modern Development Workflows
- Frequently Asked Questions
- Conclusion
What Is a Java Visualizer?
A Java visualizer is a sophisticated tool that creates graphical representations of your code's execution in real-time. Instead of just reading static text and trying to mentally trace through your program's logic, you get a dynamic, interactive view of what's happening under the hood. These tools bridge the gap between the abstract nature of programming and the concrete understanding needed to write better code.
When you use a Java visualizer, you gain access to several powerful features that traditional debugging methods simply can't provide:
- Live object diagrams that show exactly how memory is allocated and how objects reference each other in the heap
- Step-by-step execution flow with real-time variable tracking that updates as your code runs
- Visual call stacks that display the complete method execution chain, making it easy to understand program flow
- Data structure animations that show how arrays, ArrayLists, HashMaps, and other collections change as operations are performed
- Memory allocation visualization that helps you understand object lifecycle and potential memory leaks
The most popular and effective Java visualization tools include:
-
Java Tutor - A web-based tool that's perfect for beginners and educational purposes. It provides step-by-step visualization of Java code execution with a clean, intuitive interface.
-
IntelliJ IDEA Debugger - The built-in visualization features in IntelliJ IDEA offer professional-grade debugging capabilities with advanced object inspection and memory analysis tools. If you're using IntelliJ, check out our comprehensive Intellij Course to master all its debugging features.
-
JGRASP - A lightweight IDE specifically designed for educational use with automatic diagramming capabilities that generate visual representations of your code structure.
-
Eclipse Debugger - Eclipse's debugging perspective provides excellent visualization tools with detailed object inspection and memory analysis features.
-
VS Code Java Debugger - Microsoft's VS Code with the Java extension pack offers excellent debugging capabilities with integrated visualization features.
Why Use Visualization for Debugging?
Traditional debugging with print statements and console logs often feels like searching for a needle in a haystack. You add print statements, run your code, check the output, and hope you can piece together what went wrong. This approach is not only time-consuming but also prone to errors and misunderstandings.
Visualization tools give you what I like to call "X-ray vision" for your code. They allow you to see exactly what's happening at each step of execution, making it much easier to identify and fix bugs. Let's look at a practical example to illustrate this difference:
public class Main {
    public static void main(String[] args) {
        List<String> names = new ArrayList<>();
        names.add("Alex");
        names.add(1, "Jamie"); // Bug: IndexOutOfBoundsException
    }
}
When you run this code without visualization, you get a cryptic error message that might not immediately tell you what went wrong. However, with a Java visualizer, you would see:
- The
ArrayListobject being created with an initial capacity of10and size of0 - The first
add("Alex")operation increasing the size to1and storing "Alex" at index0 - The second
add(1, "Jamie")operation failing because you're trying to insert at index1when the list only has one element at index0 - The exact moment the
IndexOutOfBoundsExceptionoccurs, with a clear visual indication of the problem
This visual feedback is invaluable because it shows you not just what went wrong, but why it went wrong and how to fix it.
The benefits of visualization extend far beyond simple bug fixing. They include:
Enhanced Learning: Visualization tools make abstract programming concepts concrete. When you can see how a linked list grows, how a binary search tree balances, or how a hash map distributes elements, these concepts become much easier to understand and remember.
Improved Code Quality: By seeing exactly how your code executes, you can identify inefficiencies, unnecessary operations, and potential improvements that might not be obvious from static code review.
Faster Problem Resolution: Instead of spending hours adding print statements and guessing what might be wrong, you can quickly identify the exact point of failure and understand the root cause.
Better Collaboration: When working with teams, visualization tools make it much easier to explain complex bugs or design decisions to other developers.
Hands-On: Debugging with IntelliJ's Visualizer
IntelliJ IDEA provides one of the most powerful and user-friendly debugging environments available. Let's walk through a complete debugging session using IntelliJ's visualizer to understand how it can transform your debugging workflow.
Setting Up Your Debugging Environment
The first step in effective debugging is setting up your environment properly. In IntelliJ IDEA, this involves:
-
Setting a breakpoint: Click in the gutter (the left margin) next to the line number where you want execution to pause. A red dot will appear, indicating that execution will stop at this point.
-
Starting debug mode: Right-click on your main class or method and select "Debug 'Main'" instead of "Run 'Main'". This launches your application in debug mode with all visualization features enabled.
-
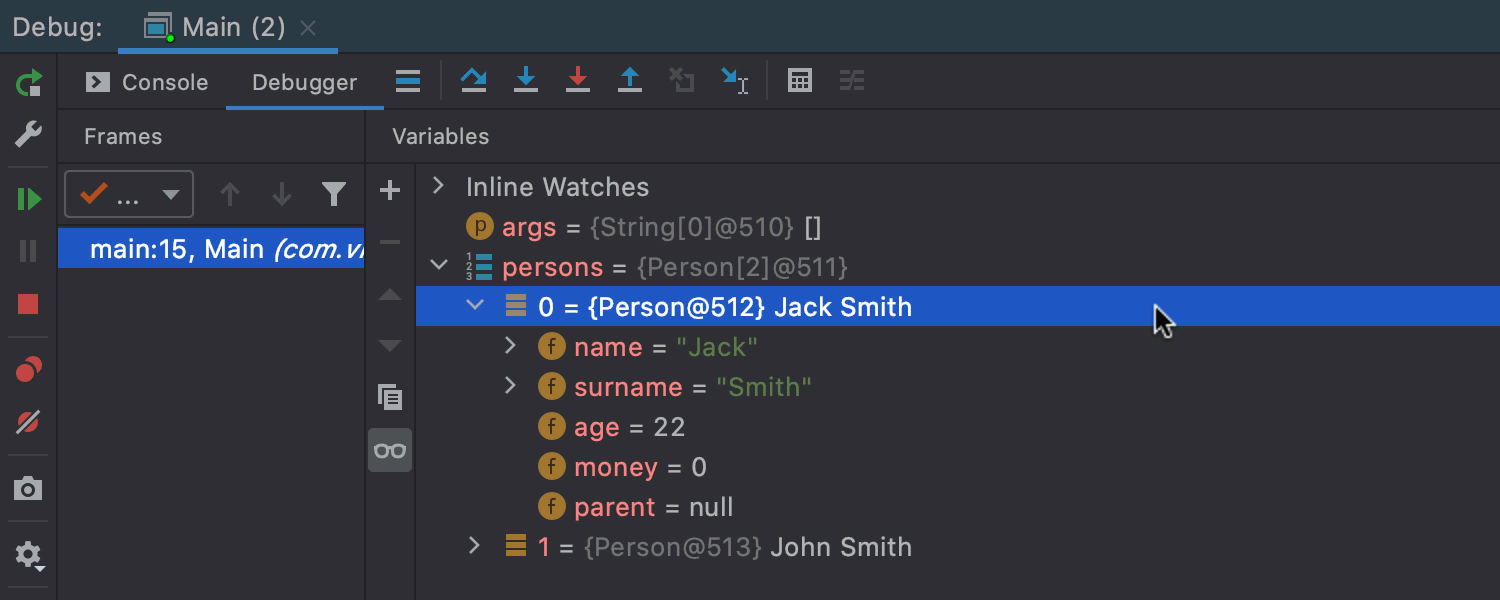
Navigating the debug interface: Once your code hits a breakpoint, you'll see several important panels:
- Variables panel: Shows all local variables, parameters, and their current values
- Watches panel: Allows you to monitor specific expressions
- Call stack: Shows the complete method call chain
- Debug console: Provides an interactive console for evaluating expressions
Inspecting Variables and Objects
One of the most powerful features of IntelliJ's visualizer is its ability to inspect complex objects in detail:
- Primitive values update in real-time as you step through your code
- Object references display as clickable trees that you can expand to see all fields and their values
- Collections expand to show their contents, making it easy to understand data structures
- Arrays display their elements in a grid format for easy inspection
For example, when debugging a complex object like a User with nested Address and Order objects, you can click through the object tree to see exactly what data is stored at each level.
Advanced Debugging Techniques
Beyond basic variable inspection, IntelliJ offers several advanced debugging features:
Conditional Breakpoints: Instead of stopping at every iteration of a loop, you can set breakpoints that only trigger when certain conditions are met. For example, you might set a breakpoint that only activates when a variable exceeds a certain value.
// Conditional breakpoint example
for (int i = 0; i < 1000; i++) {
    if (temperature > 100) {  // Set breakpoint here with condition: temperature > 100
        System.out.println("Overheating detected!");
        // Debugging logic here
    }
}
Expression Evaluation: You can evaluate any Java expression in the debug console, allowing you to test hypotheses about your code without modifying it.
Step-by-Step Execution: Use F8 (Step Over), F7 (Step Into), and Shift+F8 (Step Out) to control exactly how your code executes, giving you complete control over the debugging process.
Smart Step Into: This feature allows you to choose which method call to step into when multiple method calls are on the same line, giving you precise control over your debugging session.
Best Practices for Effective Visualization
To get the most out of Java visualizers, it's important to follow some established best practices that professional developers use:
Start Small and Isolate Problems
When you encounter a bug, resist the urge to debug your entire application at once. Instead, isolate the problematic code block first. This might involve:
- Creating a minimal reproduction case that demonstrates the bug
- Commenting out unrelated code to focus on the specific issue
- Using unit tests to create controlled debugging scenarios
This approach makes it much easier to understand what's happening and reduces the cognitive load during debugging.
Use Clear, Descriptive Variable Names
The quality of your visualization experience is directly related to how well you've named your variables and methods. Consider these examples:
// Poor naming - hard to understand in visualizer
List<String> list1 = new ArrayList<>();
list1.add("item1");
list1.add("item2");

// Better naming - clear and meaningful in visualizer
List<String> employeeNames = new ArrayList<>();
employeeNames.add("John Smith");
employeeNames.add("Jane Doe");
When you use descriptive names, the visualizer becomes much more informative because you can immediately understand what each variable represents.
Strategic Breakpoint Placement
Not all breakpoints are created equal. Learn to use different types of breakpoints strategically:
- Line breakpoints for general inspection of code flow
- Conditional breakpoints for specific scenarios (e.g., when a value exceeds a threshold)
- Exception breakpoints to catch and inspect exceptions as they occur
- Method breakpoints to pause execution whenever a specific method is called
Combine Visualization with Other Debugging Tools
While visualizers are powerful, they're most effective when used in combination with other debugging techniques:
- Unit tests help you create reproducible debugging scenarios. Our JUnit guide covers how to write effective tests for debugging.
- Logging frameworks like SLF4J and Log4j provide additional context about program execution
- Static analysis tools can identify potential issues before they become runtime bugs
Common Visualization Pitfalls and How to Avoid Them
Even experienced developers can fall into common traps when using visualization tools. Understanding these pitfalls can help you avoid them and use visualizers more effectively.
Assuming the Visualizer Shows Everything
The Pitfall: Many developers assume that visualizers provide a complete picture of what's happening in their code.
The Reality: Visualization tools have limitations and don't show everything. They typically omit:
- JVM internals like garbage collection processes
- Compiler optimizations such as loop unrolling or method inlining
- Native method calls and their internal workings
- Thread scheduling and synchronization details
How to Avoid This: Always combine visualization with other debugging techniques. Use logging, profiling tools, and system monitoring to get a complete picture of your application's behavior.
Over-Relying on Visualization
The Pitfall: Some developers become so dependent on visualizers that they struggle to debug without them.
The Reality: While visualizers are excellent tools, they're not always available. You might need to debug:
- Production environments where visualizers aren't available
- Remote systems with limited debugging capabilities
- Performance-critical code where debugging overhead is unacceptable
How to Avoid This: Practice debugging with and without visualizers. Learn to read stack traces, understand log files, and use command-line debugging tools. This makes you a more versatile and effective developer.
Ignoring Performance Implications
The Pitfall: Developers sometimes forget that visualization tools add overhead to program execution.
The Reality: While the overhead is minimal during development, it can be significant in certain scenarios:
- Large data structures with thousands of elements
- Tight loops that execute millions of times
- Real-time applications where timing is critical
How to Avoid This: Use visualization tools strategically. For performance-critical code, consider using profiling tools instead of or in addition to visualizers.
Advanced Visualization Techniques
Once you're comfortable with basic visualization, you can explore more advanced techniques that can help you debug complex scenarios.
Debugging Multithreaded Applications
Multithreaded applications present unique debugging challenges because multiple threads can execute simultaneously. Modern visualizers provide special features for this:
- Thread-specific breakpoints that only trigger for specific threads
- Thread state visualization showing which threads are running, waiting, or blocked
- Synchronization visualization highlighting lock acquisition and release
Here's an example of debugging a multithreaded application:
public class ThreadDebugExample {
    private static final Object lock = new Object();
    private static int counter = 0;

    public static void main(String[] args) {
        Thread thread1 = new Thread(() -> {
            synchronized (lock) {
                counter++;
                System.out.println("Thread 1: " + counter);
            }
        });

        Thread thread2 = new Thread(() -> {
            synchronized (lock) {
                counter++;
                System.out.println("Thread 2: " + counter);
            }
        });

        thread1.start();
        thread2.start();
    }
}
When debugging this code, you can set breakpoints that only trigger for specific threads, allowing you to trace the execution flow of each thread independently.
Memory Analysis and Leak Detection
Advanced visualizers can help you identify memory leaks and understand memory usage patterns:
- Object reference tracking showing which objects reference others
- Memory usage graphs displaying heap usage over time
- Garbage collection visualization showing when and how objects are cleaned up
Memory leaks are particularly challenging to debug without visualization tools. Consider this example:
public class MemoryLeakExample {
    private static final List<Object> cache = new ArrayList<>();

    public static void addToCache(Object obj) {
        cache.add(obj); // Potential memory leak - objects are never removed
    }

    public static void clearCache() {
        cache.clear(); // This method is never called
    }
}
With a visualizer, you can see the cache growing over time and identify that objects are being added but never removed, leading to a memory leak.
Performance Profiling Integration
Some visualization tools integrate with performance profilers to provide insights into both correctness and performance:
- Method execution time visualization showing which methods take the most time
- Hot spot identification highlighting frequently executed code paths
- Memory allocation patterns showing where memory is being allocated
Troubleshooting Common Visualization Issues
Even the best visualization tools can encounter issues. Here are some common problems and their solutions:
Visualizer Not Starting
Problem: The visualizer fails to start or doesn't respond.
Solutions:
- Check that you're running in debug mode, not run mode
- Verify that breakpoints are set correctly
- Restart your IDE and try again
- Check for conflicting plugins or extensions
Performance Issues During Visualization
Problem: The application runs very slowly when using visualization tools.
Solutions:
- Reduce the number of breakpoints
- Use conditional breakpoints instead of line breakpoints
- Limit the scope of what you're visualizing
- Consider using profiling tools for performance analysis
Incomplete Object Information
Problem: The visualizer doesn't show all object fields or methods.
Solutions:
- Check that you have the correct source code attached
- Verify that the object isn't null
- Use the "Evaluate Expression" feature to inspect specific fields
- Check if the object has been garbage collected
Alternatives When Visualizers Aren't Enough
While Java visualizers are powerful tools, there are scenarios where they might not be sufficient or available. In these cases, you need alternative debugging approaches.
For Complex Distributed Systems
When debugging distributed applications, visualization tools might not provide enough context:
- Log aggregation systems like the ELK Stack (Elasticsearch, Logstash, Kibana) can help you trace requests across multiple services
- Distributed tracing tools like Jaeger and Zipkin provide end-to-end visibility into request flows
- Application Performance Monitoring (APM) tools like New Relic or Datadog offer comprehensive system visibility
For Performance Issues
When performance is the primary concern, visualization tools might add too much overhead:
- Profiling tools like VisualVM, YourKit, or JProfiler provide detailed performance analysis without the interactive overhead of visualizers
- Benchmarking frameworks like JMH (Java Microbenchmark Harness) help you measure and optimize specific code paths
- System monitoring tools provide insights into CPU, memory, and I/O usage patterns
For Production Debugging
In production environments, you typically can't use interactive visualizers:
- Remote debugging allows you to connect a debugger to a running application (use with caution in production)
- Core dump analysis tools can help you analyze application crashes
- Flight recorder and Mission Control tools provide low-overhead production monitoring
Integration with Modern Development Workflows
Java visualizers work best when integrated into your overall development workflow. Here's how to incorporate them effectively:
Continuous Integration and Testing
Visualization tools can be integrated into your CI/CD pipeline for automated debugging:
- Automated test debugging where visualizers help identify why tests are failing
- Performance regression detection using visualization to spot performance issues early
- Code quality analysis where visualizers help identify complex or hard-to-understand code
Code Review and Pair Programming
Visualization tools can enhance code review processes:
- Interactive code reviews where reviewers can step through code execution
- Pair programming sessions where both developers can see the same execution flow
- Documentation creation where visualizations help explain complex algorithms
Learning and Training
Visualization tools are excellent for educational purposes:
- Interactive tutorials where learners can see code execution in real-time
- Algorithm visualization helping students understand complex algorithms
- Debugging workshops where participants practice debugging with visual feedback
Frequently Asked Questions
1. Are Java visualizers only for beginners?
Not at all! While visualizers are excellent learning tools, even senior engineers use them regularly. They're particularly valuable for debugging complex multithreading issues, understanding third-party library behavior, and investigating performance problems. Many experienced developers use visualizers as part of their regular debugging toolkit.
2. Do visualizers work with Spring Boot applications?
Yes, absolutely! IntelliJ IDEA and VS Code debuggers integrate seamlessly with Spring Boot applications. You can debug Spring components, inspect dependency injection, and trace request flows through your application. The visualizer will show you how Spring manages beans, handles requests, and processes data.
3. How do I visualize Java streams and lambda expressions?
Java streams and lambdas can be challenging to debug because they involve functional programming concepts. Some tools like the Java Stream Debugger plugin for IntelliJ specialize in visualizing stream operations. These tools show you how data flows through each stream operation, making it easier to understand and debug functional code.
4. Can I use visualizers in coding interviews?
Absolutely! Many modern coding platforms like LeetCode, CodeSignal, and HackerRank include built-in visualization tools. These can be incredibly helpful during interviews because they allow you to demonstrate your debugging process and show interviewers how you approach problem-solving.
5. What's the performance overhead of using visualizers?
The performance overhead is minimal during development and debugging sessions. However, you should avoid using visualizers in production environments because they can significantly impact performance. For production debugging, use logging, monitoring, and profiling tools instead.
6. How do I choose the right visualization tool for my needs?
The choice depends on your specific needs and experience level. Beginners might prefer web-based tools like Java Tutor for their simplicity, while professional developers often prefer IDE-integrated tools like IntelliJ's debugger for their power and integration. Consider factors like ease of use, feature set, and integration with your existing development environment.
7. Can visualizers help with learning design patterns?
Yes! Visualizers are excellent tools for understanding design patterns because they show you how objects interact and how patterns like Observer, Factory, or Strategy work in practice. You can see the flow of data and control through your application, making abstract patterns concrete and understandable.
8. How do I debug concurrent collections with visualizers?
Concurrent collections like ConcurrentHashMap and CopyOnWriteArrayList can be tricky to debug because their internal state changes frequently. Use thread-specific breakpoints and pay attention to the thread state panel to understand how different threads are interacting with these collections.
9. Can visualizers help with memory optimization?
Absolutely! Visualizers can show you object creation patterns, reference relationships, and memory usage trends. This information is invaluable for identifying memory leaks, optimizing object creation, and understanding garbage collection behavior.
10. How do I share visualization sessions with team members?
Some tools allow you to export debugging sessions or create recordings that can be shared with team members. This is particularly useful for explaining complex bugs or demonstrating debugging techniques to other developers.
Conclusion
A Java visualizer bridges the gap between what you think your code does and what it actually does. Whether you're working through our Spring Boot Course or debugging a personal project, fire up your IDE's debugger and see the difference for yourself.
Related Articles
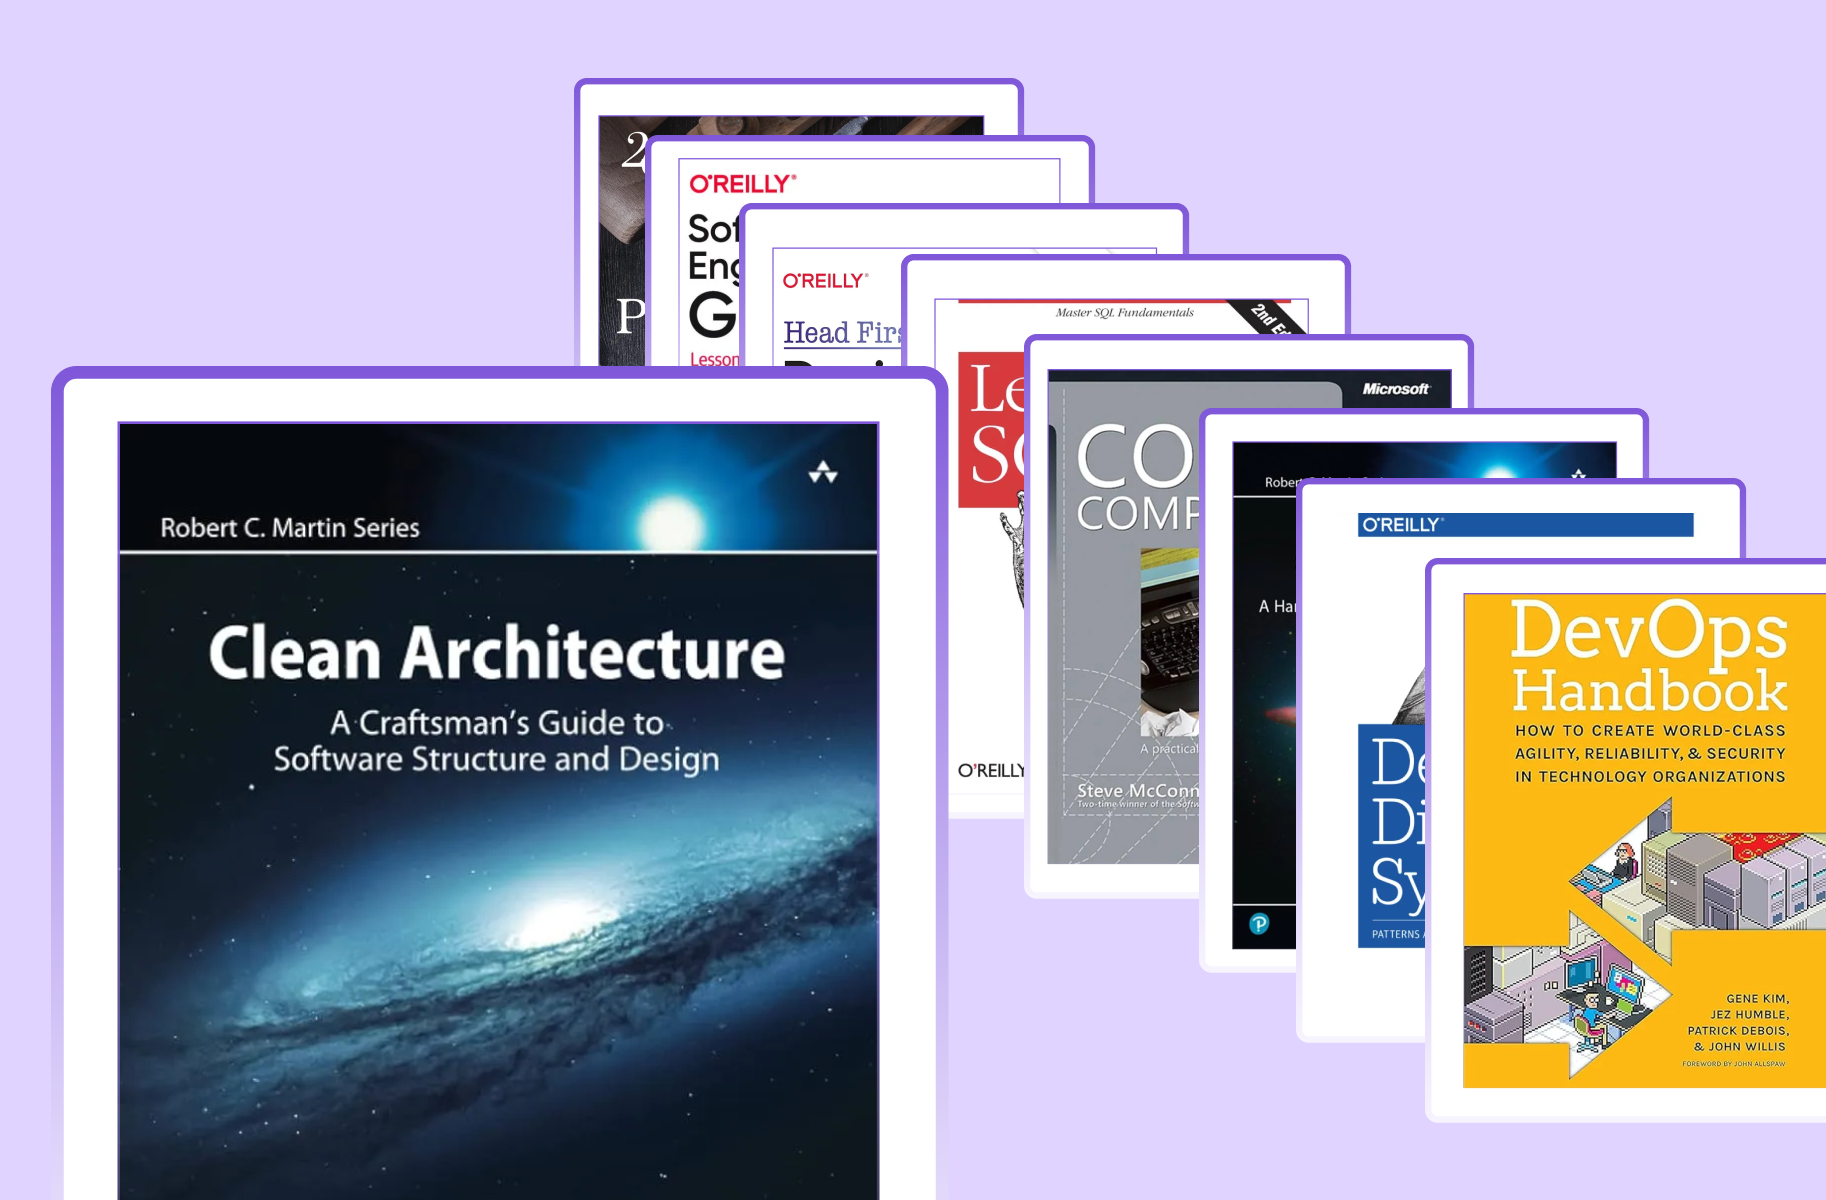
9 Books That Made Me a Better Software Engineer (Not the Usual List)
Skip the generic recommendations. These 9 books changed how I write code, lead teams, and think about systems - from Clean Code to books most devs haven't heard of.

How to Become a Java Full Stack Developer in 2025 (Step-by-Step)
The exact skills, tools, and learning order to go from zero to hired as a Java full stack developer. Covers Spring Boot, React, databases, Docker, and what employers actually look for.
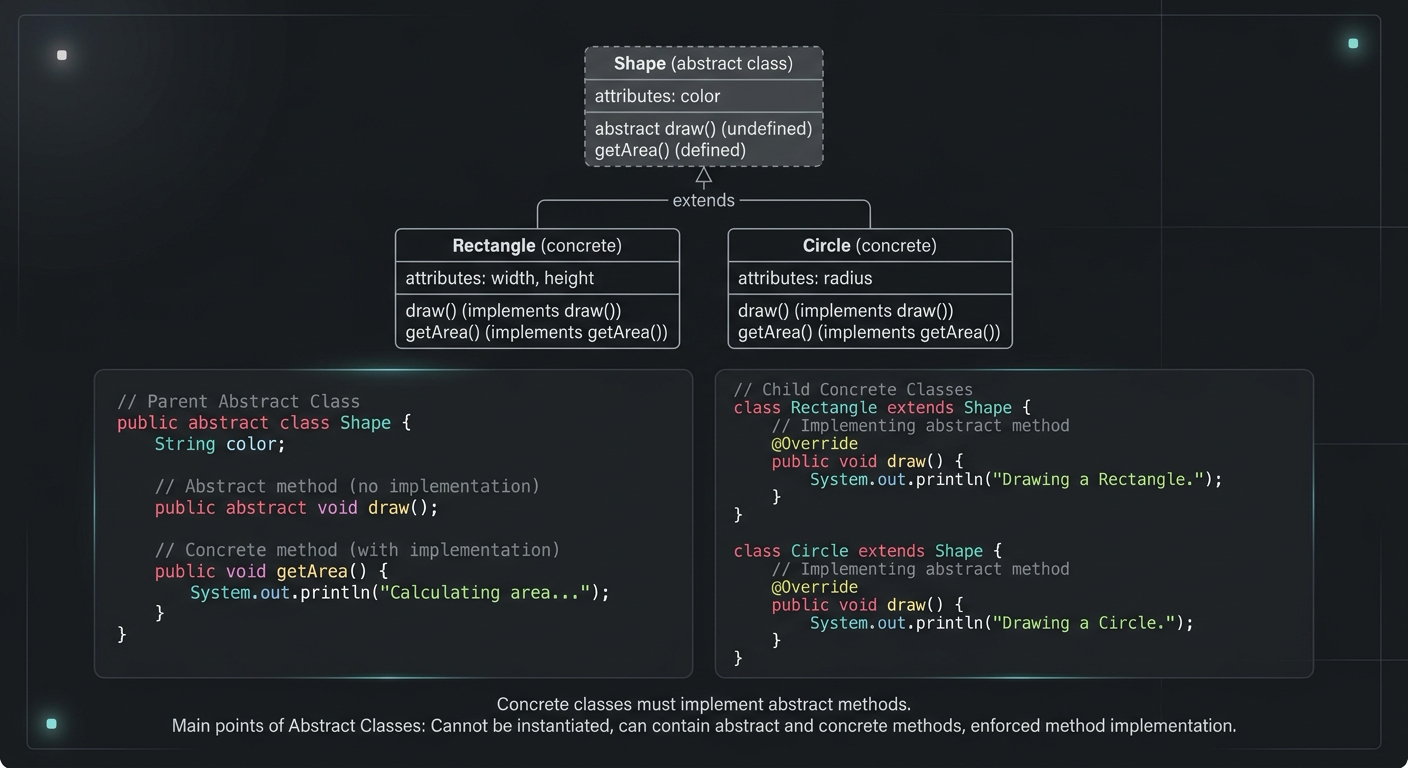
Abstract Class in Java (With Real-World Examples)
Abstract classes in Java are one of the most misunderstood OOP concepts. Here's a practical guide with real-world examples, code you can actually use, and the mistakes most devs make.
Your Career Transformation Starts Now
Join thousands of developers mastering in-demand skills with Amigoscode. Try it free today.