Spring Boot Logging: Logback, SLF4J, and Best Practices
backend
9 min read
Spring Boot Logging: Logback, SLF4J, and Best Practices
Master Spring Boot logging with Logback and SLF4J - from default config to production-ready structured JSON logs, with the patterns and pitfalls that actually matter.
Published By: Nelson Djalo | Date: April 17, 2026
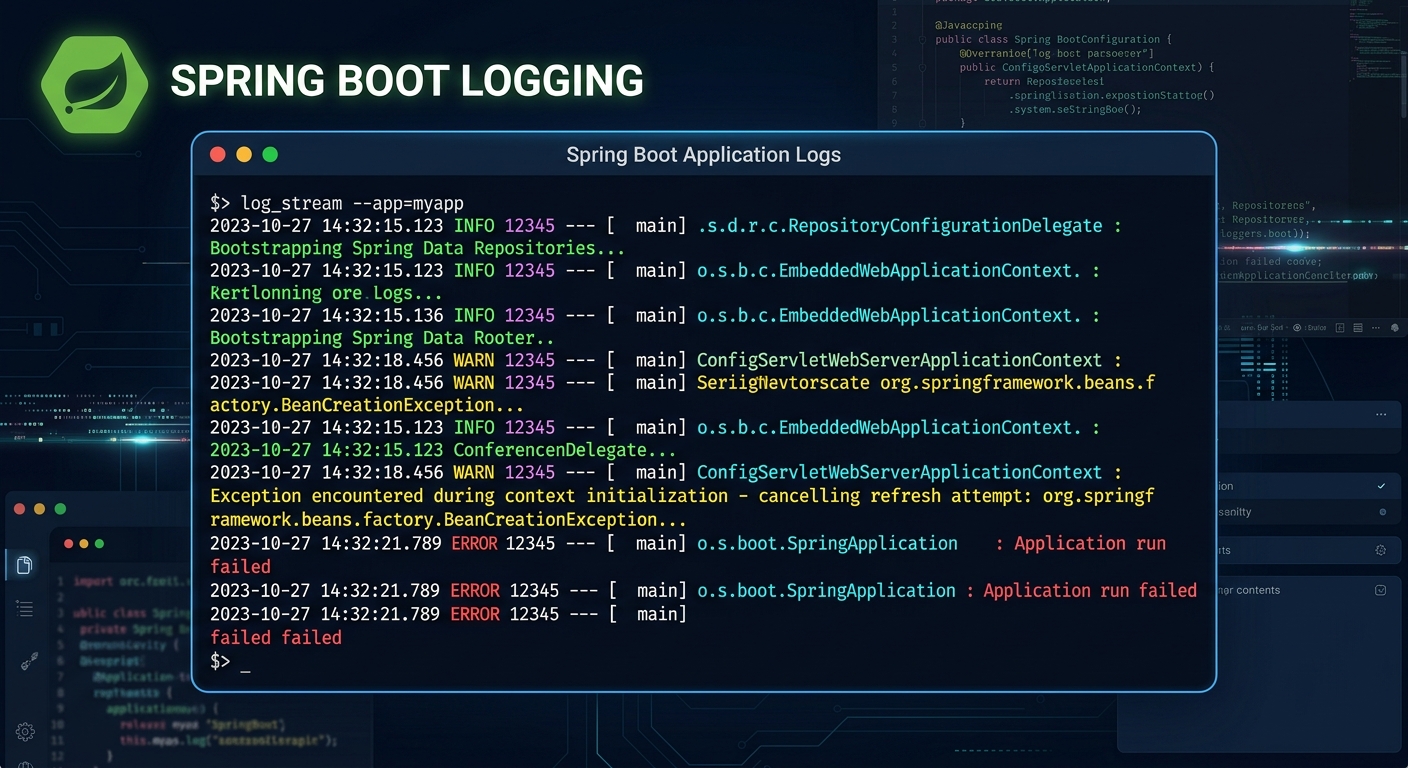
Spring Boot logging works out of the box with zero configuration. You start the app, logs appear in the console, and life is good - until your service is running in production, something breaks at 3am, and you realize your logs are unstructured, unsearchable, and rolling into the void. Getting logging right from the start saves you from that exact scenario.
This guide covers everything from the defaults Spring Boot gives you, through SLF4J and Logback configuration, all the way to structured JSON logging and the practices that keep production systems debuggable.
Table of Contents
- How Spring Boot Logging Works by Default
- SLF4J - The Logging Facade
- Log Levels and When to Use Each
- Configuring Logback with logback-spring.xml
- Logging to Files
- Structured JSON Logging
- MDC - Adding Context to Every Log Line
- Spring Boot Logging Profiles
- Common Mistakes
- Production Best Practices
- Summary
How Spring Boot Logging Works by Default
Spring Boot pulls in spring-boot-starter-logging transitively through every starter dependency. That starter brings in three things:
- SLF4J - the logging facade your code talks to
- Logback - the actual logging implementation behind SLF4J
- Bridges - adapters that route JUL, Log4j, and Commons Logging through SLF4J
Out of the box you get console output with this format:
2026-04-17 10:15:32.123 INFO 12345 --- [main] c.a.demo.Application : Started Application in 2.3 seconds
That includes a timestamp, log level, process ID, thread name, abbreviated logger name, and the message. It is surprisingly readable for a default, and for local development it is usually enough. The moment you need file output, filtering, or structured logs, you need to configure things yourself.
SLF4J - The Logging Facade
SLF4J (Simple Logging Facade for Java) sits between your application code and the logging implementation. You write your log statements against SLF4J, and at runtime the actual work is delegated to whatever backend is on the classpath - in Spring Boot's case, Logback.
Here is what logging looks like in practice:
import org.slf4j.Logger;
import org.slf4j.LoggerFactory;
import org.springframework.stereotype.Service;

@Service
public class OrderService {

    private static final Logger log = LoggerFactory.getLogger(OrderService.class);

    public void placeOrder(String orderId, String customerId) {
        log.info("Placing order {} for customer {}", orderId, customerId);

        try {
            // process order
            log.debug("Validating inventory for order {}", orderId);
            // ...
            log.info("Order {} placed successfully", orderId);
        } catch (Exception e) {
            log.error("Failed to place order {}", orderId, e);
        }
    }
}
A few things to notice. The {} placeholders are parameterized - SLF4J only builds the string if the log level is actually enabled, which avoids wasted CPU on string concatenation. Always use parameterized logging instead of string concatenation. And when logging exceptions, pass the exception as the last argument so the full stack trace gets printed.
If you are using Lombok, you can skip the boilerplate with @Slf4j:
import lombok.extern.slf4j.Slf4j;
import org.springframework.stereotype.Service;

@Slf4j
@Service
public class PaymentService {

    public void processPayment(String paymentId) {
        log.info("Processing payment {}", paymentId);
    }
}
Both approaches produce identical output. Pick whichever your team prefers and stay consistent.
Log Levels and When to Use Each
Spring Boot logging supports the standard SLF4J levels, from most to least severe:
| Level | Use For |
|---|---|
ERROR | Something broke. An operation failed and needs attention. |
WARN | Something unexpected happened but the system recovered. |
INFO | Normal operations worth recording - startup, shutdown, key business events. |
DEBUG | Detailed diagnostic info for development and troubleshooting. |
TRACE | Extremely fine-grained output. Rarely used outside framework debugging. |
The default level is INFO, which means DEBUG and TRACE are suppressed. You can change this globally or per-package in application.yml:
logging:
  level:
    root: WARN
    com.amigoscode: DEBUG
    org.springframework.web: INFO
    org.hibernate.SQL: DEBUG
This sets the root logger to WARN, your own packages to DEBUG, Spring MVC to INFO, and Hibernate SQL logging to DEBUG so you can see the actual queries being executed.
A common mistake is leaving DEBUG on for everything in production. That floods your logs with framework internals and buries the signals you care about. Be surgical - set DEBUG only on the packages you are actively troubleshooting.
Configuring Logback with logback-spring.xml
For anything beyond basic level tweaks, you want a logback-spring.xml file in src/main/resources. Spring Boot picks it up automatically and it gives you full control over appenders, patterns, and filters.
Here is a solid starting configuration:
<?xml version="1.0" encoding="UTF-8"?>
<configuration>

    <include resource="org/springframework/boot/logging/logback/defaults.xml"/>

    <property name="LOG_PATH" value="${LOG_PATH:-./logs}"/>
    <property name="APP_NAME" value="my-service"/>

    <!-- Console appender -->
    <appender name="CONSOLE" class="ch.qos.logback.core.ConsoleAppender">
        <encoder>
            <pattern>%d{yyyy-MM-dd HH:mm:ss.SSS} %highlight(%-5level) [%thread] %cyan(%logger{36}) - %msg%n</pattern>
        </encoder>
    </appender>

    <!-- Rolling file appender -->
    <appender name="FILE" class="ch.qos.logback.core.rolling.RollingFileAppender">
        <file>${LOG_PATH}/${APP_NAME}.log</file>
        <rollingPolicy class="ch.qos.logback.core.rolling.SizeAndTimeBasedRollingPolicy">
            <fileNamePattern>${LOG_PATH}/${APP_NAME}.%d{yyyy-MM-dd}.%i.log.gz</fileNamePattern>
            <maxFileSize>50MB</maxFileSize>
            <maxHistory>30</maxHistory>
            <totalSizeCap>1GB</totalSizeCap>
        </rollingPolicy>
        <encoder>
            <pattern>%d{yyyy-MM-dd HH:mm:ss.SSS} %-5level [%thread] %logger{36} - %msg%n</pattern>
        </encoder>
    </appender>

    <root level="INFO">
        <appender-ref ref="CONSOLE"/>
        <appender-ref ref="FILE"/>
    </root>

    <logger name="com.amigoscode" level="DEBUG"/>

</configuration>
This gives you color-coded console output for local development and compressed rolling log files that cap at 1GB total. The SizeAndTimeBasedRollingPolicy rotates files daily and also splits them at 50MB so individual files stay manageable.
Notice the include at the top - that pulls in Spring Boot's default conversions and patterns, which means Spring-specific features like profile-based configuration still work.
Logging to Files
If you do not need a full logback-spring.xml, Spring Boot has shorthand properties for file logging:
logging:
  file:
    name: logs/application.log
  logback:
    rollingpolicy:
      max-file-size: 50MB
      max-history: 30
      total-size-cap: 1GB
This creates a rolling log file with the same policies as the XML config above. For simple setups this is perfectly fine. Once you need multiple appenders, conditional logic, or structured output, switch to the XML file.
Structured JSON Logging
Plain text logs are great for humans reading a terminal. They are terrible for log aggregation tools like Elasticsearch, Datadog, or CloudWatch. Structured logging outputs each log event as a JSON object, which these tools can parse, index, and query without regex gymnastics.
Spring Boot 3.4+ ships with built-in structured logging support. Add this to your application.yml:
logging:
  structured:
    format:
      console: ecs
That switches console output to Elastic Common Schema format. You can also use logstash format or define a custom structure.
For earlier Spring Boot versions, add the Logstash encoder dependency:
<dependency>
    <groupId>net.logstash.logback</groupId>
    <artifactId>logstash-logback-encoder</artifactId>
    <version>7.4</version>
</dependency>
Then configure it in logback-spring.xml:
<appender name="JSON_CONSOLE" class="ch.qos.logback.core.ConsoleAppender">
    <encoder class="net.logstash.logback.encoder.LogstashEncoder">
        <includeMdcKeyName>requestId</includeMdcKeyName>
        <includeMdcKeyName>userId</includeMdcKeyName>
    </encoder>
</appender>
Your output becomes:
{
  "@timestamp": "2026-04-17T10:15:32.123Z",
  "level": "INFO",
  "logger_name": "com.amigoscode.OrderService",
  "message": "Order ORD-123 placed successfully",
  "requestId": "abc-def-789",
  "userId": "user-42"
}
Every field is queryable. You can search for all errors from a specific user, all events tied to a request ID, or all logs from a specific service. This is non-negotiable for production systems running more than one instance.
MDC - Adding Context to Every Log Line
Mapped Diagnostic Context (MDC) lets you attach key-value pairs to the current thread. Every log statement on that thread automatically includes those values. This is how you correlate logs across a single request.
import org.slf4j.MDC;
import jakarta.servlet.FilterChain;
import jakarta.servlet.http.HttpServletRequest;
import jakarta.servlet.http.HttpServletResponse;
import org.springframework.stereotype.Component;
import org.springframework.web.filter.OncePerRequestFilter;

@Component
public class RequestLoggingFilter extends OncePerRequestFilter {

    @Override
    protected void doFilterInternal(HttpServletRequest request,
                                     HttpServletResponse response,
                                     FilterChain filterChain)
            throws Exception {

        String requestId = request.getHeader("X-Request-Id");
        if (requestId == null) {
            requestId = java.util.UUID.randomUUID().toString();
        }

        MDC.put("requestId", requestId);
        try {
            filterChain.doFilter(request, response);
        } finally {
            MDC.clear();
        }
    }
}
Now every log line within a request includes the requestId automatically. When a user reports an issue, you search for their request ID and get the full story in order. The finally block is critical - without it, MDC values leak into other requests on the same thread (thread pools reuse threads).
Spring Boot Logging Profiles
Use logback-spring.xml (not plain logback.xml) to access Spring profile support:
<springProfile name="local">
    <root level="DEBUG">
        <appender-ref ref="CONSOLE"/>
    </root>
</springProfile>

<springProfile name="production">
    <root level="INFO">
        <appender-ref ref="JSON_CONSOLE"/>
        <appender-ref ref="FILE"/>
    </root>
</springProfile>
Local development gets verbose console output. Production gets structured JSON piped to both console and file. Same config file, different behavior per environment.
Common Mistakes
String concatenation in log statements. This builds the string even when the level is disabled:
// Bad - string is built regardless of log level
log.debug("Processing order " + orderId + " for customer " + customerId);

// Good - string is only built if DEBUG is enabled
log.debug("Processing order {} for customer {}", orderId, customerId);
Logging sensitive data. Passwords, tokens, credit card numbers, and PII have no business in your logs. Audit your log statements and mask anything sensitive.
Catching exceptions without logging them. If you catch an exception and only log the message, you lose the stack trace:
// Bad - stack trace is gone
log.error("Payment failed: " + e.getMessage());

// Good - full stack trace is preserved
log.error("Payment failed for order {}", orderId, e);
Using System.out.println. It bypasses the logging framework entirely - no levels, no filtering, no file output, no structure. Replace every System.out.println with a proper log call.
Not cleaning up MDC. Forgetting MDC.clear() in a finally block causes context to leak between requests when threads are pooled.
Production Best Practices
-
Use structured logging. JSON output is searchable, parseable, and works with every major log aggregation platform.
-
Set appropriate levels.
INFOfor production root,DEBUGonly for packages you are actively investigating. Rotate back toINFOwhen done. -
Include correlation IDs. Use MDC to tag every log line with a request ID. In microservice architectures, propagate that ID across service calls.
-
Cap log file sizes. Rolling policies with
totalSizeCapprevent logs from eating all your disk space at 3am. -
Log business events, not just technical ones. "Order placed", "Payment processed", "User signed up" - these are the logs you will actually search for.
-
Use async appenders for high-throughput services. Logback's
AsyncAppenderwraps any appender and moves the IO to a separate thread so your request thread is not blocked by disk writes. -
Externalize configuration. Use environment variables or Spring profiles so you can change log levels without redeploying.
If you want to go deeper on building production-grade Spring Boot applications - including logging, monitoring, and deployment - the Spring Boot Master Class covers all of it end to end.
Summary
Spring Boot gives you a solid logging foundation out of the box with SLF4J and Logback. For local development the defaults are fine. For production you need to think about file rotation, structured JSON output, MDC for request correlation, and sensible log levels per package. The key patterns: always use parameterized logging, never log sensitive data, always clean up MDC, and always use structured output when logs flow into an aggregation tool. Get these right once and your future self will thank you when something breaks at 3am.
Related Articles

9 Books That Made Me a Better Software Engineer (Not the Usual List)
Skip the generic recommendations. These 9 books changed how I write code, lead teams, and think about systems - from Clean Code to books most devs haven't heard of.

How to Become a Java Full Stack Developer in 2025 (Step-by-Step)
The exact skills, tools, and learning order to go from zero to hired as a Java full stack developer. Covers Spring Boot, React, databases, Docker, and what employers actually look for.
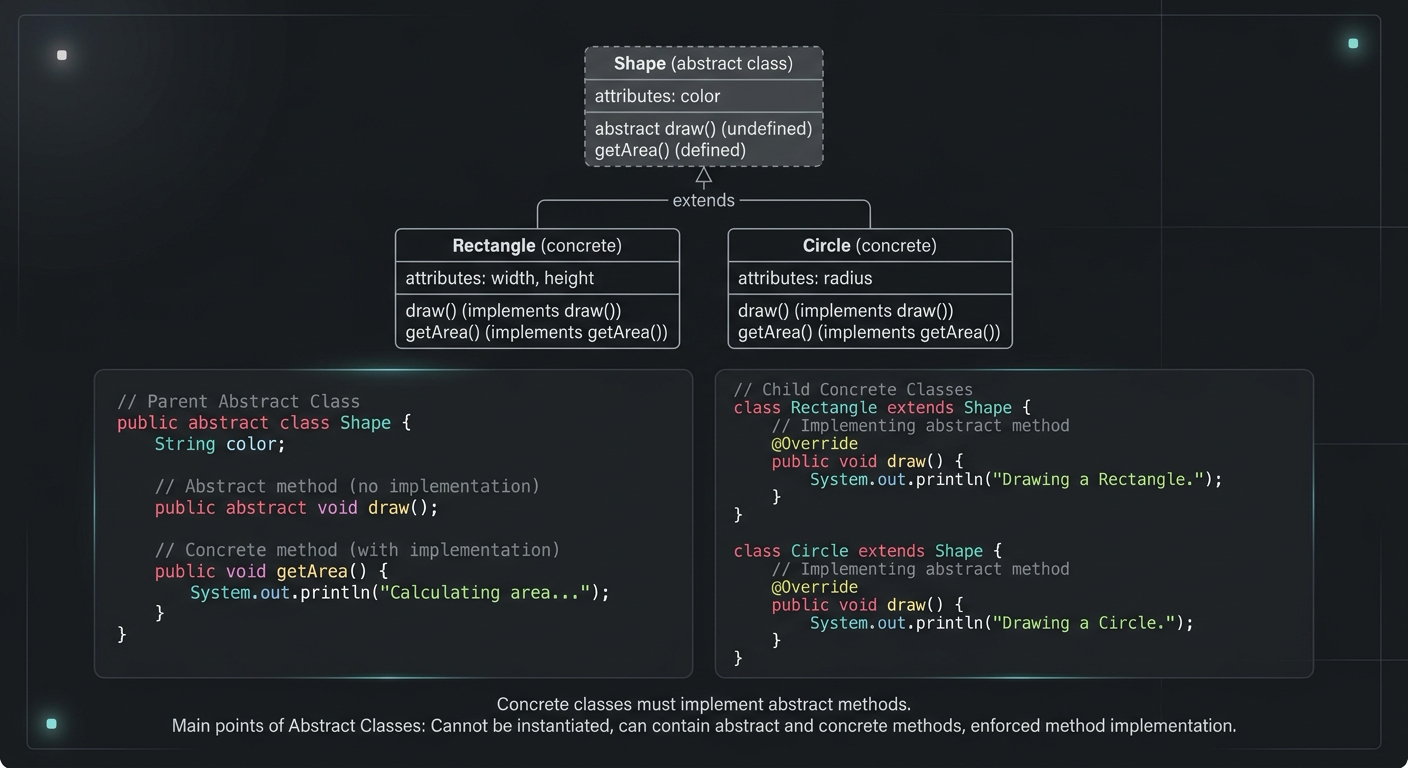
Abstract Class in Java (With Real-World Examples)
Abstract classes in Java are one of the most misunderstood OOP concepts. Here's a practical guide with real-world examples, code you can actually use, and the mistakes most devs make.
Your Career Transformation Starts Now
Join thousands of developers mastering in-demand skills with Amigoscode. Try it free today.